Richland County, Illinois
Richland County | |
|---|---|
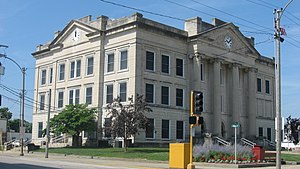
 Richland County Courthouse in Olney | |
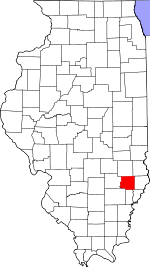
 Location within the U.S. state of Illinois | |
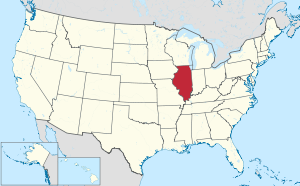
 Illinois's location within the U.S. | |
| Coordinates: 38°43′N 88°05′W / 38.71°N 88.09°W | |
| Country | |
| State | |
| Founded | February 24, 1841 |
| Named for | Richland County, Ohio |
| Seat | Olney |
| Largest city | Olney |
| Area | |
• Total | 362 sq mi (940 km2) |
| • Land | 356 sq mi (920 km2) |
| • Water | 1.9 sq mi (5 km2) 0.5% |
| Population (2020) | |
• Total | 15,813 |
• Estimate (2021) | 15,796 |
| • Density | 44/sq mi (17/km2) |
| Time zone | UTC−6 (Central) |
| • Summer (DST) | UTC−5 (CDT) |
| Congressional district | 12th |
Richland County is a county located in the U.S. state of Illinois. According to the 2020 United States census, it had a population of 15,813.[1] Its county seat is Olney.[2][3]: County Seats
History
[edit]Richland County was established in 1841 out of portions of East part of Clay and West part of Lawrence counties.[4] It was named for Richland County, Ohio, where many of the early settlers migrated from.[3]: Origin of the name of the county
-
Richland County at the time of its creation in 1841
Geography
[edit]According to the U.S. Census Bureau, the county has a total area of 362 square miles (940 km2), of which 360 square miles (930 km2) is land[5]: Population tab, Population Density sub-tab and 1.9 square miles (4.9 km2) (0.5%) is water.[6]
Climate and weather
[edit]| Olney, Illinois | ||||||||||||||||||||||||||||||||||||||||||||||||||||||||||||
|---|---|---|---|---|---|---|---|---|---|---|---|---|---|---|---|---|---|---|---|---|---|---|---|---|---|---|---|---|---|---|---|---|---|---|---|---|---|---|---|---|---|---|---|---|---|---|---|---|---|---|---|---|---|---|---|---|---|---|---|---|
| Climate chart (explanation) | ||||||||||||||||||||||||||||||||||||||||||||||||||||||||||||
| ||||||||||||||||||||||||||||||||||||||||||||||||||||||||||||
| ||||||||||||||||||||||||||||||||||||||||||||||||||||||||||||
In recent years, average temperatures in the county seat of Olney have ranged from a low of 19 °F (−7 °C) in January to a high of 88 °F (31 °C) in July, although a record low of −25 °F (−32 °C) was recorded in February 1951 and a record high of 112 °F (44 °C) was recorded in July 1936. Average monthly precipitation ranged from 2.73 inches (69 mm) in February to 4.76 inches (121 mm) in May.[7]
Transit
[edit]Major highways
[edit]Adjacent counties
[edit]- Jasper County (north)
- Crawford County (northeast)
- Lawrence County (east)
- Wabash County (southeast)
- Edwards County (south)
- Wayne County (southwest)
- Clay County (west)
Demographics
[edit]| Census | Pop. | Note | %± |
|---|---|---|---|
| 1850 | 4,012 | — | |
| 1860 | 9,711 | 142.0% | |
| 1870 | 12,803 | 31.8% | |
| 1880 | 15,545 | 21.4% | |
| 1890 | 15,019 | −3.4% | |
| 1900 | 16,391 | 9.1% | |
| 1910 | 15,970 | −2.6% | |
| 1920 | 14,044 | −12.1% | |
| 1930 | 14,053 | 0.1% | |
| 1940 | 17,137 | 21.9% | |
| 1950 | 16,889 | −1.4% | |
| 1960 | 16,299 | −3.5% | |
| 1970 | 16,829 | 3.3% | |
| 1980 | 17,587 | 4.5% | |
| 1990 | 16,545 | −5.9% | |
| 2000 | 16,149 | −2.4% | |
| 2010 | 16,233 | 0.5% | |
| 2020 | 15,813 | −2.6% | |
| 2023 (est.) | 15,488 | [8] | −2.1% |
| U.S. Decennial Census[9] 1790–1960[10] 1900–1990[11] 1990–2000[12] 2010–2013[13] 2020[5] | |||
As of the 2010 United States census, there were 16,233 people, 6,726 households, and 4,438 families residing in the county.[14] By 2020, the population had decreased to 15,813 people.[5]: Population tab, Population Density sub-tab The 2010 population density was 45.1 inhabitants per square mile (17.4/km2), which decreased to 43.1 inhabitants per square mile (16.6/km2) in the 2020 census.[5]: Population tab, Population Density sub-tab In 2010, there were 7,513 housing units, compared to 7,364 in 2020,[5]: Housing tab, Occupied Units sub-tab at an average density of 20.9 per square mile (8.1/km2).[6] The 2010 racial makeup of the county was 97.3% white (94.2%, 2020![]() ), 0.7% Asian (0.8%, 2020
), 0.7% Asian (0.8%, 2020![]() ), 0.5% black or African American (same, 2020), 0.2% American Indian (same, 2020), 0.4% (0.5%, 2020
), 0.5% black or African American (same, 2020), 0.2% American Indian (same, 2020), 0.4% (0.5%, 2020![]() ) from other races, and 0.9% from two or more races (3.7%, 2020
) from other races, and 0.9% from two or more races (3.7%, 2020![]() ).[5]: for 2020—Race alone tab, all sub-tabs Those of Hispanic or Latino origin made up 1.3% (1.7%, 2020
).[5]: for 2020—Race alone tab, all sub-tabs Those of Hispanic or Latino origin made up 1.3% (1.7%, 2020![]() ) of the population.[5]: Hispanic Origin tab, Hispanic or Latino sub-tab [14] In terms of ancestry, 29.6% were German, 11.7% were American, 11.4% were English, and 9.2% were Irish.[15]
) of the population.[5]: Hispanic Origin tab, Hispanic or Latino sub-tab [14] In terms of ancestry, 29.6% were German, 11.7% were American, 11.4% were English, and 9.2% were Irish.[15]
Of the 6,726 households, 28.9% had children under the age of 18 living with them, 51.7% were married couples living together, 9.6% had a female householder with no husband present, 34.0% were non-families, and 29.3% of all households were made up of individuals. The average household size was 2.36 and the average family size was 2.88. The median age was 42.1 years.[14]
The median income for a household in the county was $41,917 and the median income for a family was $53,853. Males had a median income of $41,058 versus $31,296 for females. The per capita income for the county was $22,874. About 9.5% of families and 13.8% of the population were below the poverty line, including 15.1% of those under age 18 and 11.9% of those age 65 or over.[16] Richland is the top ranked most affordable county in Illinois to buy a car and is on average $932 less expensive than other Illinois counties.[17]
Communities
[edit]City
[edit]- Olney (seat)
Villages
[edit]Unincorporated communities
[edit]Townships
[edit]Richland County is divided into nine townships:[3]: Township Names
Notable people
[edit]- Alexander W. Swanitz (1851–1915), civil engineer who participated in the construction of railroads in various parts of the country
- Dial D. Ryder (1938–2011), gun smith
Politics
[edit]| Year | Republican | Democratic | Third party(ies) | |||
|---|---|---|---|---|---|---|
| No. | % | No. | % | No. | % | |
| 2024 | 5,889 | 75.94% | 1,747 | 22.53% | 119 | 1.53% |
| 2020 | 6,089 | 75.39% | 1,830 | 22.66% | 158 | 1.96% |
| 2016 | 5,739 | 74.59% | 1,584 | 20.59% | 371 | 4.82% |
| 2012 | 4,756 | 65.31% | 2,362 | 32.44% | 164 | 2.25% |
| 2008 | 4,329 | 56.42% | 3,181 | 41.46% | 163 | 2.12% |
| 2004 | 5,153 | 66.50% | 2,529 | 32.64% | 67 | 0.86% |
| 2000 | 4,718 | 63.52% | 2,491 | 33.54% | 219 | 2.95% |
| 1996 | 3,137 | 46.03% | 2,679 | 39.31% | 999 | 14.66% |
| 1992 | 3,053 | 37.87% | 3,286 | 40.76% | 1,722 | 21.36% |
| 1988 | 4,264 | 59.61% | 2,863 | 40.03% | 26 | 0.36% |
| 1984 | 5,665 | 71.95% | 2,182 | 27.71% | 27 | 0.34% |
| 1980 | 5,241 | 64.50% | 2,463 | 30.31% | 422 | 5.19% |
| 1976 | 4,434 | 55.03% | 3,485 | 43.25% | 138 | 1.71% |
| 1972 | 5,558 | 68.41% | 2,553 | 31.42% | 14 | 0.17% |
| 1968 | 4,781 | 58.76% | 2,495 | 30.66% | 861 | 10.58% |
| 1964 | 3,901 | 47.92% | 4,239 | 52.08% | 0 | 0.00% |
| 1960 | 5,329 | 63.80% | 3,015 | 36.09% | 9 | 0.11% |
| 1956 | 5,304 | 68.05% | 2,485 | 31.88% | 5 | 0.06% |
| 1952 | 5,569 | 68.42% | 2,565 | 31.51% | 5 | 0.06% |
| 1948 | 3,884 | 60.56% | 2,438 | 38.02% | 91 | 1.42% |
| 1944 | 4,577 | 60.91% | 2,858 | 38.04% | 79 | 1.05% |
| 1940 | 5,022 | 53.17% | 4,335 | 45.89% | 89 | 0.94% |
| 1936 | 4,040 | 47.57% | 4,268 | 50.26% | 184 | 2.17% |
| 1932 | 2,765 | 38.50% | 4,318 | 60.12% | 99 | 1.38% |
| 1928 | 4,042 | 61.03% | 2,550 | 38.50% | 31 | 0.47% |
| 1924 | 3,082 | 50.07% | 2,749 | 44.66% | 324 | 5.26% |
| 1920 | 3,026 | 57.05% | 2,174 | 40.99% | 104 | 1.96% |
| 1916 | 2,992 | 45.09% | 3,431 | 51.70% | 213 | 3.21% |
| 1912 | 811 | 21.80% | 1,800 | 48.39% | 1,109 | 29.81% |
| 1908 | 1,684 | 44.13% | 1,938 | 50.79% | 194 | 5.08% |
| 1904 | 1,778 | 48.20% | 1,604 | 43.48% | 307 | 8.32% |
| 1900 | 1,793 | 45.58% | 2,042 | 51.91% | 99 | 2.52% |
| 1896 | 1,693 | 44.55% | 2,062 | 54.26% | 45 | 1.18% |
| 1892 | 1,500 | 43.35% | 1,542 | 44.57% | 418 | 12.08% |
Government
[edit]| Office | Office holder |
|---|---|
| County Board Chairman | Dennis Graves (R) |
| County Board Vice Chairman | Morgan Henton (R) |
| County Board Member - District 1 | Brian VanBlaricum (R) |
| County Board Member - District 2 | Dennis Graves (R) |
| County Board Member - District 3 | Alexis McFarland (R) |
| County Board Member - District 4 | Cynthia Given (D) |
| County Board Member - District 5 | Morgan Henton (R) |
| County Board Member - District 6 | Travis Paddock (R) |
| County Board Member - District 7 | Steve Schonert (R) |
| County Clerk | Amanda Troyer (R) |
| County Circuit Clerk | Zach Holder (R) |
| County Treasurer | Mike Hahn (R) |
| County Assessor | Tim Hahn (R) |
| Coroner | Steve Patterson (R) |
| States Attorney | Chelsey Clark (R) |
| County Sheriff | Andy Hires (R) |
See also
[edit]References
[edit]- ^ "QuickFacts". United States Census Bureau. Retrieved January 23, 2023.
- ^ "Find a County". National Association of Counties. Archived from the original on May 31, 2011. Retrieved June 7, 2011.
- ^ a b c "Richland County". Illinois Regional Archives Depository (IRAD) System. Office of the Illinois Secretary of State. Retrieved January 22, 2023.
- ^ Morrison, Kate. "The Church". Historical Sketch of the First Methodist Episcopal Church of Olney, Illinois, 1841–1909. p. 5 – via Internet Archive.
- ^ a b c d e f g "2020 Census Demographic Data Map Viewer". Retrieved January 22, 2023.
- ^ a b "Population, Housing Units, Area, and Density: 2010 – County". United States Census Bureau. Archived from the original on February 12, 2020. Retrieved July 12, 2015.
- ^ a b "Monthly Averages for Olney, Illinois". The Weather Channel. Retrieved January 27, 2011.
- ^ "Annual Estimates of the Resident Population for Counties: April 1, 2020 to July 1, 2023". United States Census Bureau. Retrieved April 2, 2024.
- ^ "U.S. Decennial Census". United States Census Bureau. Retrieved July 8, 2014.
- ^ "Historical Census Browser". University of Virginia Library. Retrieved July 8, 2014.
- ^ "Population of Counties by Decennial Census: 1900 to 1990". United States Census Bureau. Retrieved July 8, 2014.
- ^ "Census 2000 PHC-T-4. Ranking Tables for Counties: 1990 and 2000" (PDF). United States Census Bureau. Retrieved July 8, 2014.
- ^ "State & County QuickFacts". United States Census Bureau. Archived from the original on August 26, 2011. Retrieved July 8, 2014.
- ^ a b c "DP-1 Profile of General Population and Housing Characteristics: 2010 Demographic Profile Data". United States Census Bureau. Archived from the original on February 13, 2020. Retrieved July 12, 2015.
- ^ "DP02 SELECTED SOCIAL CHARACTERISTICS IN THE UNITED STATES – 2006–2010 American Community Survey 5-Year Estimates". United States Census Bureau. Archived from the original on February 13, 2020. Retrieved July 12, 2015.
- ^ "DP03 SELECTED ECONOMIC CHARACTERISTICS – 2006–2010 American Community Survey 5-Year Estimates". United States Census Bureau. Archived from the original on February 13, 2020. Retrieved July 12, 2015.
- ^ "Used Car Market in Chicago, IL". Autolist. Retrieved February 6, 2017.
- ^ Leip, David. "Dave Leip's Atlas of U.S. Presidential Elections". uselectionatlas.org.
- ^ "The City of Olney, Illinois". www.ci.olney.il.us. City of Olney. Retrieved February 27, 2021.


